Launching Tweetmap: Animated maps of real-time tweets using contiguous cartograms
In this entry I announce Tweetmap, a data visualisation project that I have been working on with a friend for the past 2 months. Complex, fun, and beautiful – it was a challenge to make.
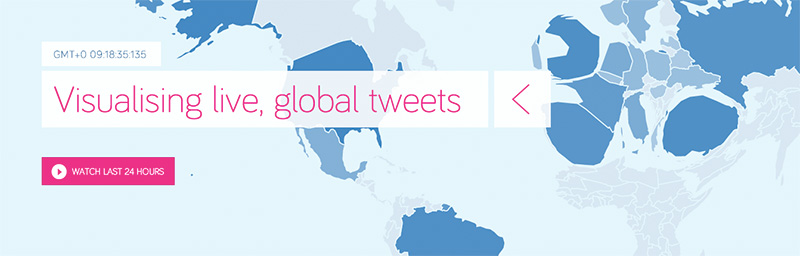
Over the past 2 months, Pete Smart and I have been working on a beautiful data visualisation project. Today we can finally announce the launch of Tweetmap – animated maps of real-time and historic tweets using contiguous cartograms.
Under the hood, Tweetmap uses TopoJSON, d3.js, Node.js, and PhantomJS. I'll be writing more about the technology and lessons learnt (many of them) in the coming weeks.
For now, enjoy the project and let me know on Twitter what you think!