ViziCities release roundup
In this entry I round up the coverage and statistics from the first week since ViziCities was launched to the public. I also hint at some future features.
Last Saturday evening, ViziCities was finally released to the public as an open-source project. Ever since then things have been absolutely crazy and incredibly hard to keep up with.
Have an idea for ViziCities, or just want to get in touch about it? Email us at hello@vizicities.com and we'll get back to you as soon as we can.
Statistics
Let's start with a roundup of the raw statistics from the past week. They may not mean much to you but I think they're interesting and it can't hurt to share them and use them to track progress in the future.
Mailchimp
- Launch email sent to 4,528 people
- 58.6% open rate (industry average is 19.6%)
- 5,647 total opens (includes multiple opens per person)
- 32.5% click rate (industry average is 2.6%)
- 2,521 total clicks (includes multiple clicks per person)
- 38 bounces
- 43 people unsubscribed
- Subscriber count at beginning of week: 4,528
- Subscriber count at end of week: 6,422
Google Analytics
- 8,985 unique visits to the ViziCities demo over the week
- 65% using Chrome
- 17% using Firefox
- 9% using Safari
- 4% using IE
- 10,042 unique visits to ViziCities.com over the week
- 59% using Chrome
- 15% using Safari
- 14% using Firefox
- 7% using IE
GitHub
- 874 stars
- 96 watching
- 74 forks
Coverage
The Next Web
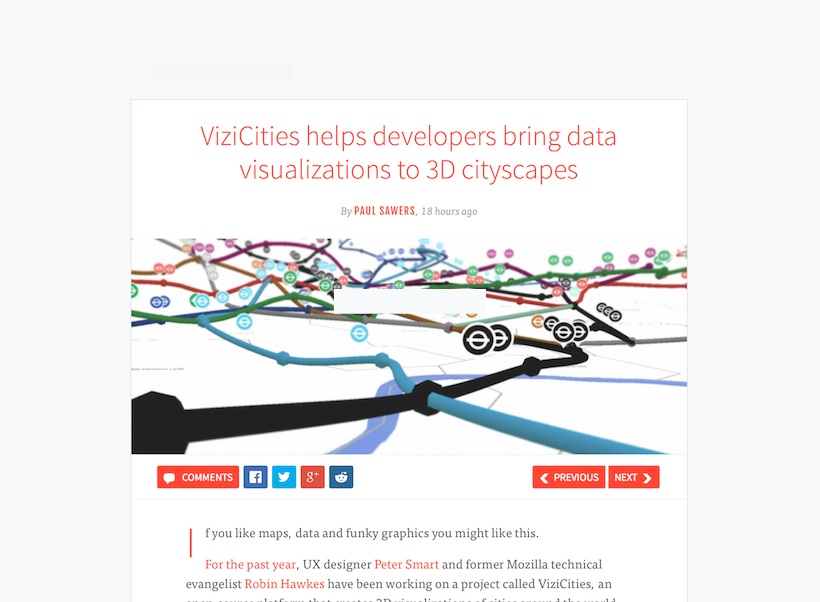
On Tuesday evening, The Next Web posted an article about ViziCities on their Insider channel.
ViziCities is one to watch for sure.
Of all the coverage this week, The Next Web was the only one to trigger a huge influx of tweets related to the project.
Daily Mail
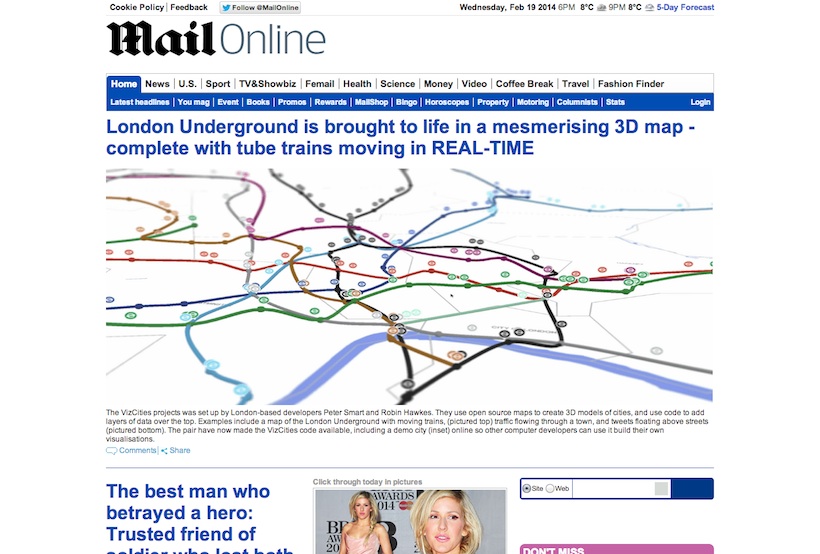
Wednesday morning saw the Daily Mail run a piece about ViziCities on their website. For those who don't know, the Daily Mail website currently has a daily unique readership of around 11.8 million people. In other words, anything put there gets read by a shit-load of people.
A pair of developers from London used open source data to build an interactive 3D map of the tube network, complete with moving trains. The visualisation was built to showcase the ViziCities project. Its creators have made the code behind the project available for anyone to use.
We enjoyed a huge amount of traffic and interest from the Daily Mail audience, helped in part by ViziCities being featured as the headline article on the front page for most of the evening. I've no idea how we managed to get on the front page for so long, though I'm certainly not complaining!
Of all the coverage this week, the Daily Mail has been the most surreal and the one that has provided the most follow-ups. It's also been the only coverage this week that presented ViziCities in a way that the general public will be able to understand and take interest in.
The flip-side to being featured by the Daily Mail is that you have to endure a particular section of their readership, who provided an eloquent commentary on the project (displayed unedited for your pleasure); such as:
well that's 2 minutesof my life I'll never get back :(
And this thought-provoking statement…
My hardworked taxes towards yet another frivolous vanity project. How is thins gooing to benefit ME?!!? The only help I need I can get from the big brain between my ears.
I'm afraid we can't divulge where we spent all your hard-earned taxes, sorry. I wish we knew!
This was another…
WOW this is amazing, in actual 3D! trains are soooo interesting!! i could just watch them all day..... NOT
It really did seem like everyone loved ViziCities…
What a silly and pointless thing to create
It's a real eye-opener of a project…
Wow i just fell asleep there watching it. It's not very exciting is it?
And my personal favourite…
For a moment I thought wow that's interesting, but its passed now.
We aim to please. I'm just glad we were able to achieve that!
Seriously though, we're incredibly pleased to have been given the opportunity to be featured on the Daily Mail. 99.9% of the response has been positive and we've been absolutely astounded by it.
One of the weirdest moments from the Daily Mail coverage was when the daughter of a long-time family friend and old neighbour got in touch with me on Facebook for the first time ever, letting me know that her mum had seen the article and had phoned her about it. That alone proved to me the value of this coverage, that friends and members of the public who don't follow technology were finding it and actually reading it — all because it was on the Daily Mail. Insane!
ITV
On Thursday, ITV News ran a piece on ViziCities on their website.
It's a new and exciting way of looking at the London Underground. For the past year Peter Smart and Robin Hawkes have been working on a 3D map that brings cities to life using the power of open data and the Web.
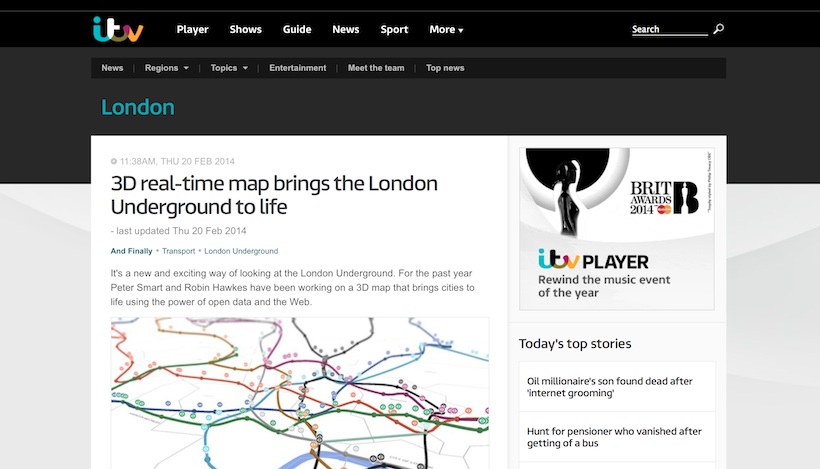
We were hugely excited about being featured by ITV as they're a huge media organisation within the UK. Interestingly, we received next to no traffic as a result. This was likely because the article didn't have any links back to the project for a while, but even then it didn't seem to do much.
Our experience with the ITV coverage taught us that just because you're on a big website with a large audience doesn't mean anything. In a way it's analogous to the number of Twitter followers not being representative of how many people will click links in tweets you post.
For a good few days we were on top of the JavaScript sub-Reddit, and even enjoyed a good response in other sub-Reddits.
HTML5 Weekly #125
A WebGL-powered 3D city and data visualization platform. It’s flexible in its operation but can do things like let you visualize the London Underground train network in real time.
Web Design Weekly #127
ViziCities is a 3D city and data visualisation platform, powered by WebGL. Its purpose is to change the way you look at cities and the data contained within them. It is the brainchild of Robin Hawkes and Peter Smart.
Codrops Collective #104
ViziCities is a 3D city and data visualization platform powered by WebGL. A fantastic project by Robin Hawkes and Peter Smart.
Response
We've been overwhelmed with the amount of people who are excited about ViziCities and want to see it succeed. It's actually a little unbelievable.
Since launch there have been 3 merged pull requests from the community and a significant fork looking at adding physics to ViziCities. Seeing people actually want to help out is incredibly weird.
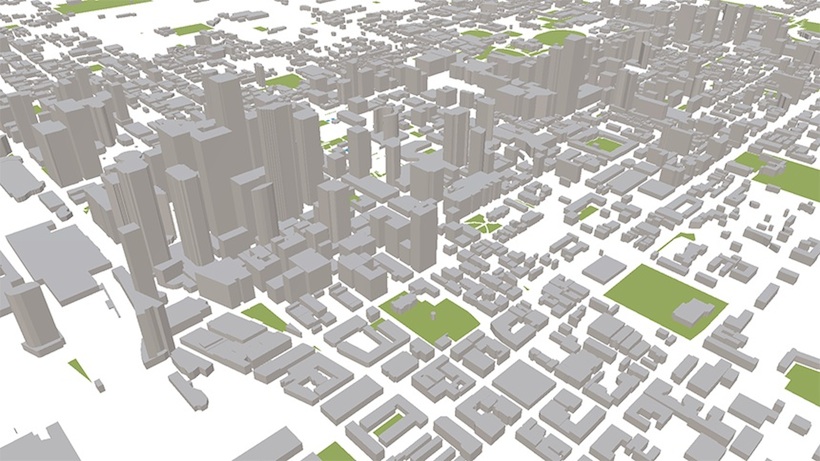
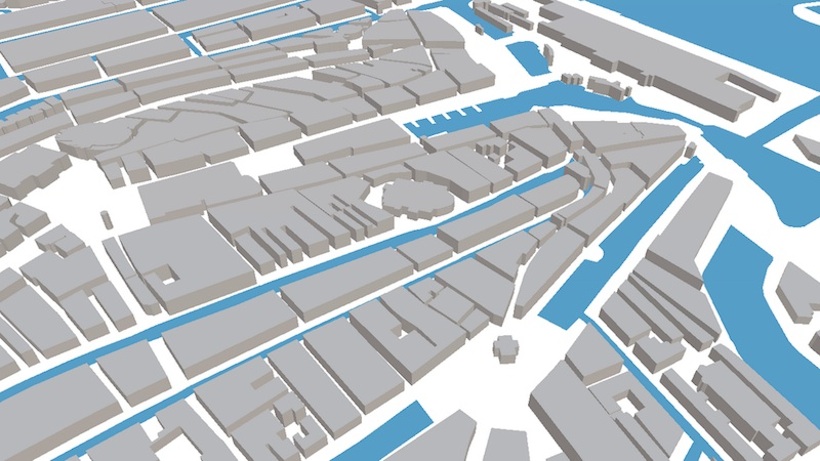
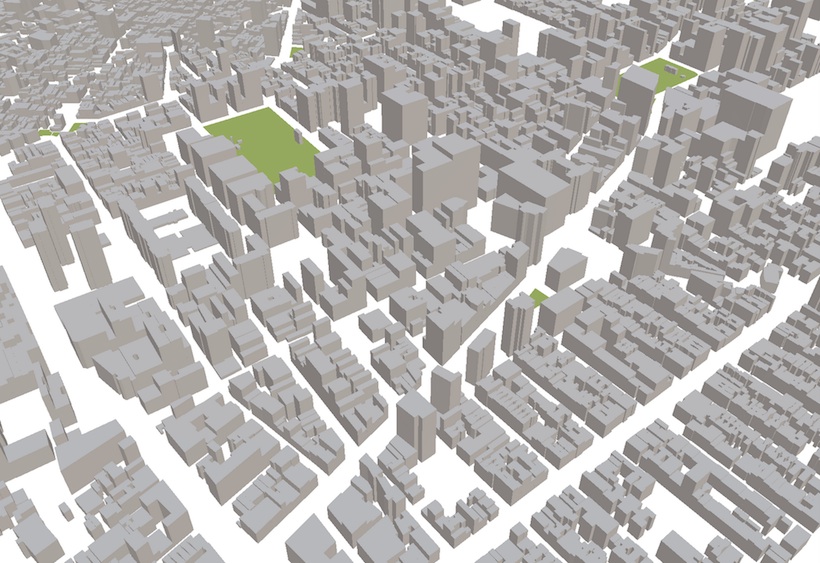
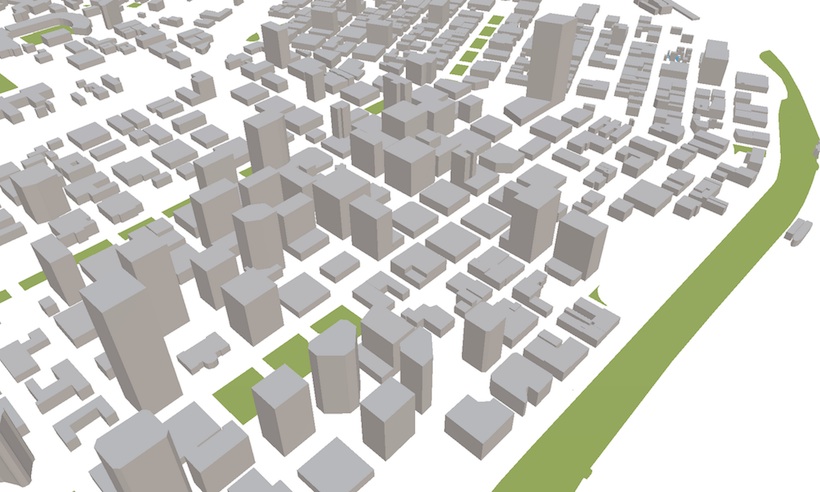
Another thing that's taken us by surprise is the amount of people sending in screenshots of ViziCities showing their local area.
Also, the number of organisations and data providers reaching out to us about visualising their data in the project has been amazing. We already have the future of some key features confirmed thanks to people like Plane Finder and Network Rail. We've so much more to catch up on!
What's next?
I think it's safe to say that the first week of ViziCities going open-source has been amazing and overwhelming, but we're not going to stop there. Now that the project is finally out in the open we're able to focus on refining things and getting them working as best as we can, ideally with help from the community.
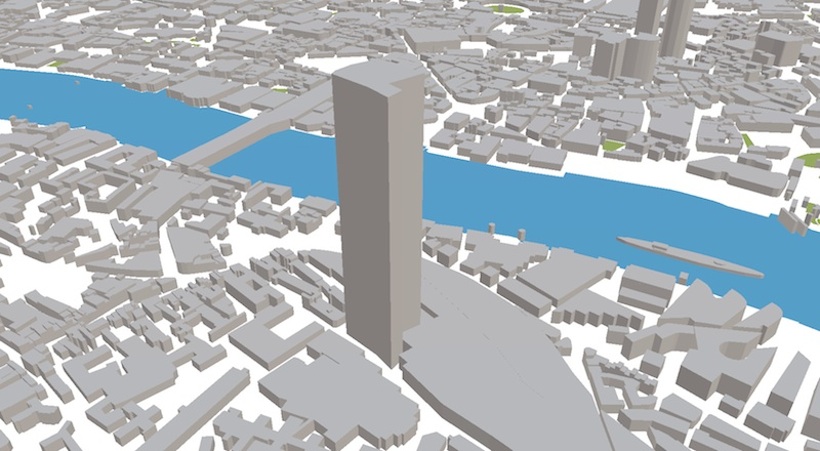
Even in the past 7 days I've been able to hack together experimental support for 3D terrain and live, 3D air traffic.
Watch this space…
Have an idea for ViziCities, or just want to get in touch about it? Email us at hello@vizicities.com and we'll get back to you as soon as we can.