ViziCities development diary #1: One month in
In this entry I outline the significant progress made with ViziCities since the project was announced a month ago. Expect many screenshots and a lot of detail.
Update: The second Developer Diary is out
Just over a month ago I announced ViziCities, the latest project from Pete Smart and myself. We're not quite ready to release it yet but make sure you sign up for the beta to be the first to use it. In the meantime, let me fill you in on what we've been up to this past month.
Note: This entry is focussed on the development side of ViziCities. Pete is working on the UI and UX side of things and we will update you on that progress separately.
What is ViziCities?
Although it's entirely obvious to Pete and myself, describing ViziCities has always been slightly difficult. This isn't because it's hard to understand, more that it's a combination of many things and we're still looking for that succinct elevator pitch.
Bringing cities to life
At the most basic level, ViziCities is about bringing cities to life using the power of the Web. At a slightly more wordy level, it's about creating an interactive 3D city visualisation platform that is beautiful, fun and engaging.
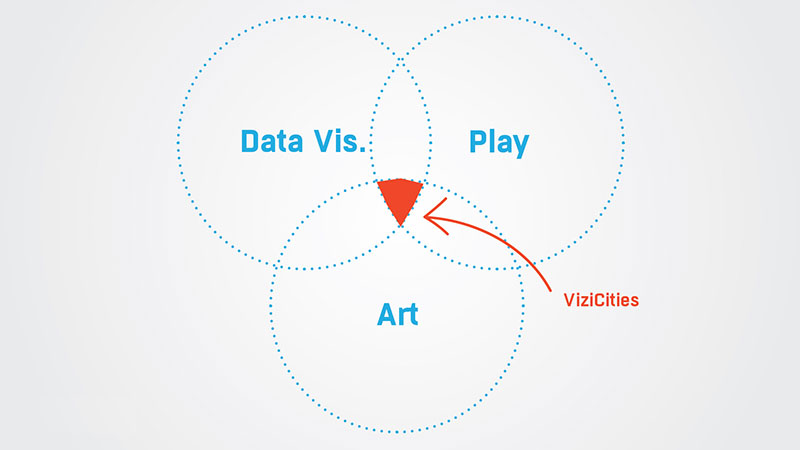
Intersection of data, art and play
The best way we've found to describe the project so far is that it sits at the intersection of data, art and play. What's great about describing it this way is that it means we get to create a Venn diagram, and who doesn't enjoy a good Venn diagram?
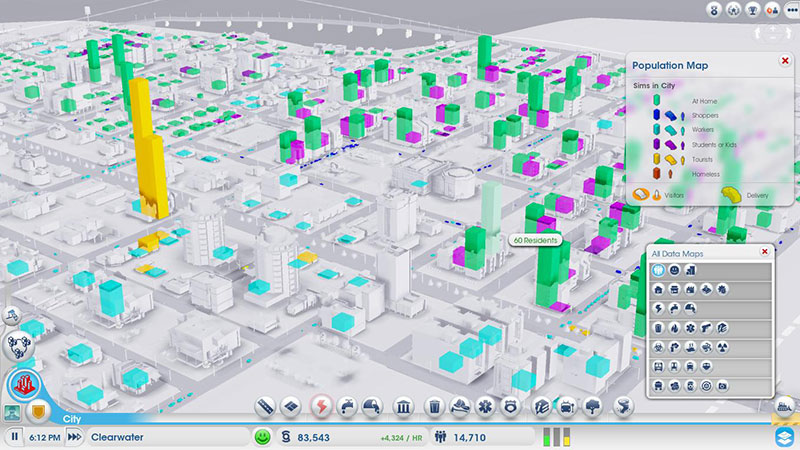
Inspired by SimCity
The original concept for ViziCities was to use WebGL to replicate the data layers from the new SimCity game. There's something about visualising huge quantities of data about a city in 3D. It's sort of sexy, in a weird way.
Update: Richard Shemaka, the principle engineer at Maxis for data layers in SimCity is a fan of the project. We're gobsmacked!
A gappsite
Something we still haven't worked out is how to describe the media format that ViziCities falls under. It's not a game, yet it has many game-like features and takes a lot from game design. It's not an app, yet it acts like an app and is technically built like one. It's not a website, yet it sort of is one.
So what is it? The best we've come up with so far is that it's a gappsite. That'll do until we think of something more serious. If you hadn't guessed, we really haven't put too much thought into this yet.
Created in our spare time
Although not important to describing the project, it has turned out that a lot of people have assumed that there is a large team working on ViziCities, or that we're being paid to do this. So is there, and are we?
No. Pete and I are the only 2 working on this and we're doing it in our spare time. This is a lot easier for me, seeing as I quit Mozilla back in January to do exactly this without having to worry about income. Last month alone we worked out that I sank around 300 hours into the project!
1 month ago we had nothing
I'm still quite amazed that just over a month ago ViziCities was nothing more than a crazy idea and an empty scene set up in Three.js (a WebGL library).
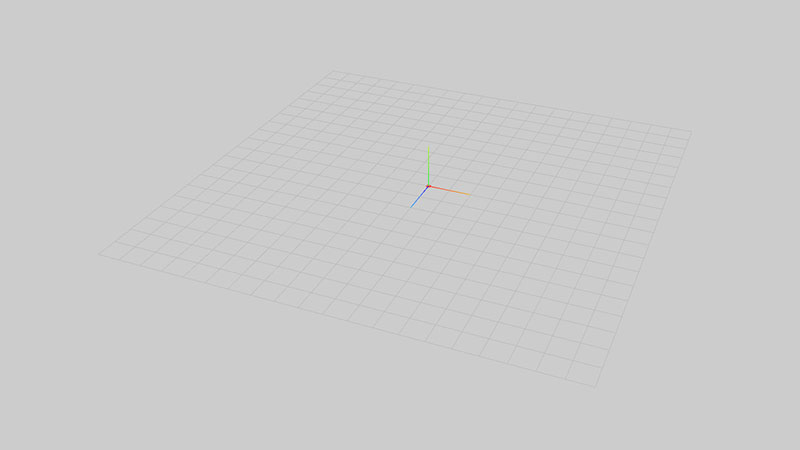
Not only did we have nothing created (aside from a camera that you could rotate, woo), we also had very little idea about how to turn this vision into a reality. Fortunately, the whole reason I do projects like this is to learn something new — I thrive off the fear of the unknown; that feeling you get when you find yourself out of your depth.
If only we knew how much there was to learn…
Finding the data
The biggest problem by far has been finding accurate, usable data for the locations that we plan to visualise in 3D. For the proof of concept, we've been specifically looking for data about London. Why London? I was brought up there, we both live in the UK, and we assumed it would have copious amounts of free and easily accessible data.
Wrong.
Sort of…
We already knew that there were plenty of free sources of data for London (and the UK); like Data.gov.uk, the London Datastore, Ordnance Survey OpenData, OpenStreetMap, the Office for National Statistics, and Police.uk. These gave us the bulk of what we needed (census data, crime, geographic features, etc.) however they're all in different file formats, level of detail, and often represent areas in different ways. It's a mess.
Most annoying has been finding accurate building outline and height data. I assumed this would be freely available (like in the US) but it turns out that you either need to be in full-time higher education, or have a tonne of money at your disposal. I'm no longer a student and don't have the budget to buy building data for all of London (let alone the UK), so we've had to make do with the super-simple building outlines from Ordnance Survey's VectorMap dataset. The unfortunate thing about this is, aside from the low detail, there is no height data for the buildings so we've had to come up with a method of performing an educated guess.
If you're involved in the building data side of things or know someone who is, please send an email to hello@vizicities.com as we'd love to make buildings in ViziCities more accurate for London.
Working out how to use the data
The second biggest problem has been working out how to use the data we've collected and learning how to use the related tools. Neither Pete or I have any significant experience with GIS (Geographic Information System) software or the related data practices. We had a long way to go.
Reading geographic data
Fortunately, it turns out that there are a few usual formats that geographic data is provided in. In our case, we ended up using data provided in what's called a shapefile. To read this data you can use a free piece of software called QGIS, which is effectively Photoshop for geographic data analysis.
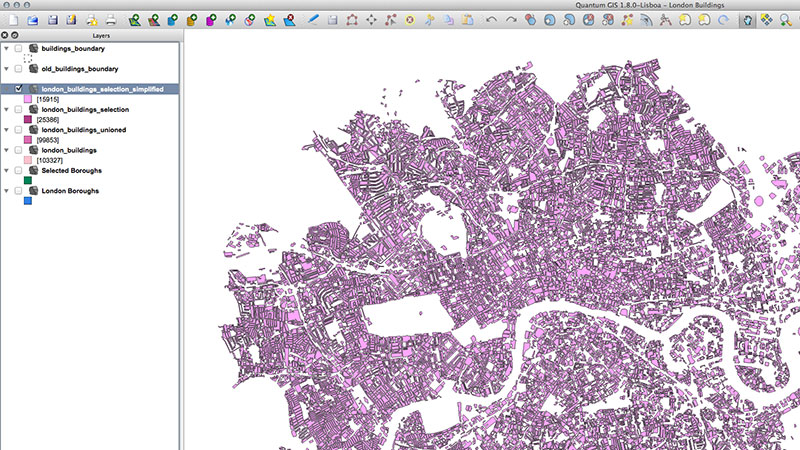
QGIS allows you to open the shapefile data and manipulate it using a slightly complicated GUI (which you do get used to). It also lets you do complex analysis, as well as importing and merging of external data. Basically, if you're doing anything serious with GIS then you'll likely end up using QGIS or the proprietary alternative, ArcGIS.
Enter PostGIS
While QGIS is great, it only gets you so far as the features I needed weren't multi-threaded, or particularly quick. It also periodically locks up whenever you're playing with a large quantity of data, like every single building in London. It's good for initial manipulation but I needed something more robust for the hardcore data manipulation.
PostGIS is the solution to this problem. It's an extension to the Postgres database format that provides a huge amount of geographic functionality, allowing for super-quick spatial analysis.
To put things in perspective, an intensive process that takes hours in QGIS (and locking it up) can potentially take just a matter of minutes in PostGIS if you do things right. It's a no brainer.
Getting help via the GIS StackExchange
Arguably the most useful source of help for me during the early development of ViziCities has been the GIS StackExchange. It's hands down the most useful source of information for common GIS problems, and even those that aren't so common.
Visualising things in WebGL
What I thought would be the most difficult step actually turned out to be one of the simplest. The beauty of geographic data is that it's commonly stored as points, lines, or polygons, which map perfectly to 2D and 3D drawing platforms like WebGL. The only thing that I needed to do was export the data into an optimised GeoJSON format and convert the geographic coordinates for each point into pixel coordinates. Simple.
Adding buildings
The most interesting aspect to me, at least at the beginning of the project, was visualising building data for cities in 3D. This hasn't really been done before in WebGL, at least not outside projects with massive development teams and budgets (like Google Maps and Nokia Maps).
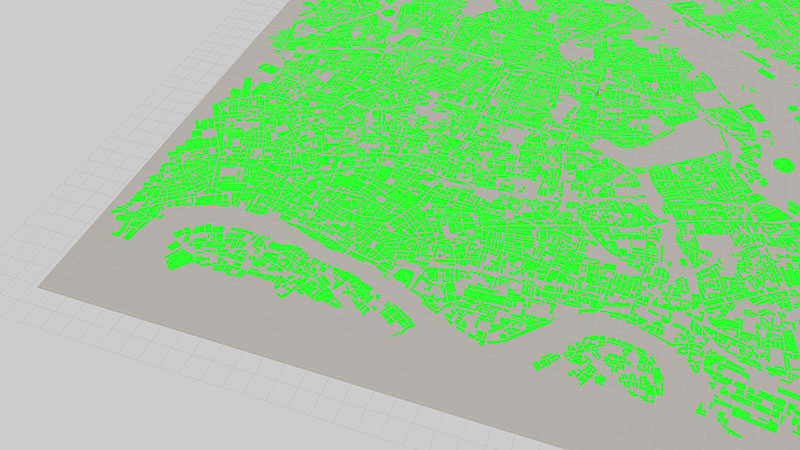
To keep things simple, and because I was sure it wouldn't work, I tried outputting the centroid (centre) position for every building in a 'small' 8x8km section of London. To my amazement, it worked!
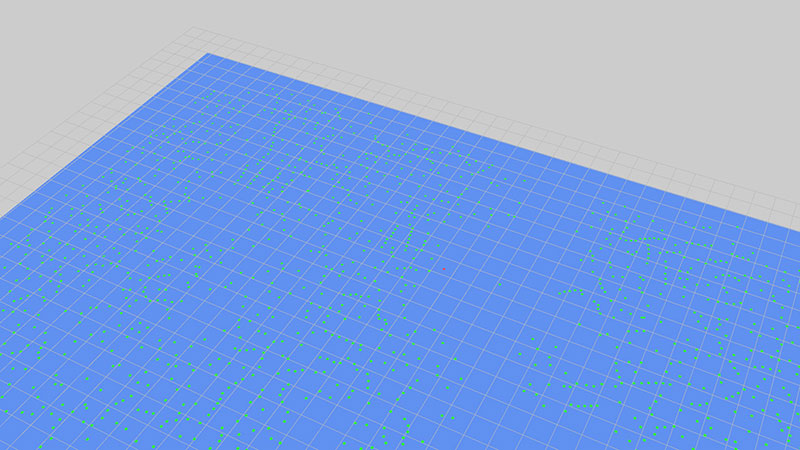
However, having points for buildings is not that glamorous. What's needed instead is polygons, a seemingly complex process. The good news was that Three.js had functionality built in to construct shapes (polygons) from a collection of individual points, which was perfect considering that GeoJSON represents polygons (buildings) as a collection of points.
The result was a solid shape for every building in our section of London, all in WebGL.
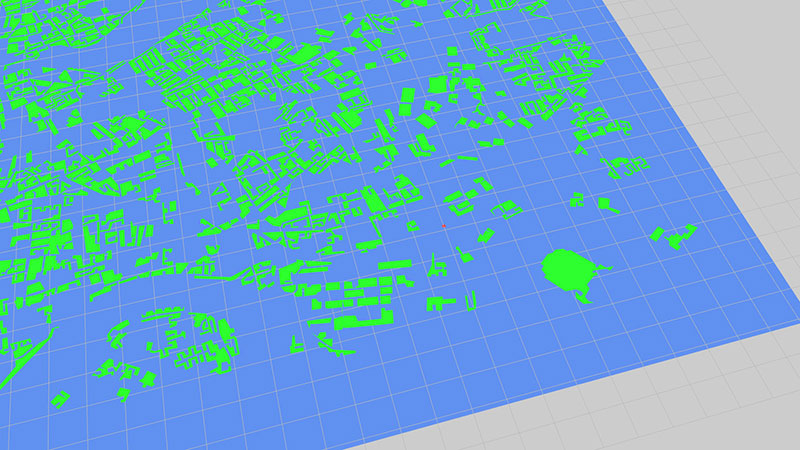
At this point I was gobsmacked at a) how easy this turned out to be, and b) how beautiful it was. It's one thing to visualise procedural data, but visualising real-life data and recognising it is quite another. If you squint, you can even see the outline of the Thames at the bottom.
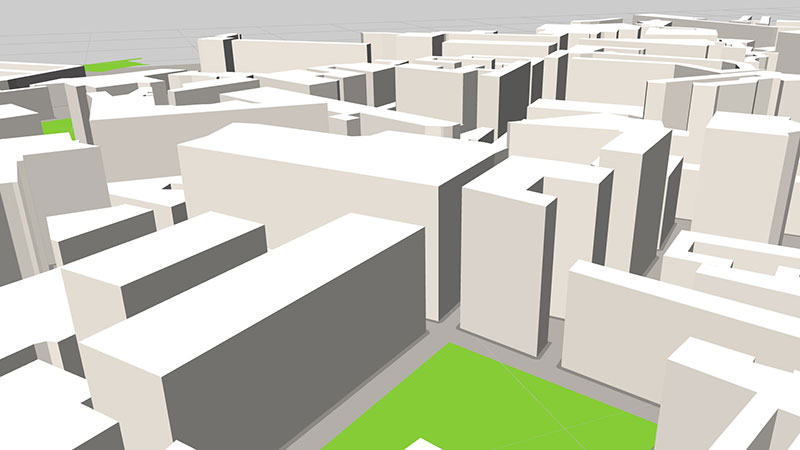
I wasn't prepared to stop at 2D outlines. The whole point of this project is to visualise cities in 3D, so the next step was turning the polygon shapes into full-blown 3D objects. Three.js again came to the rescue with its ability to extrude 2D shapes.
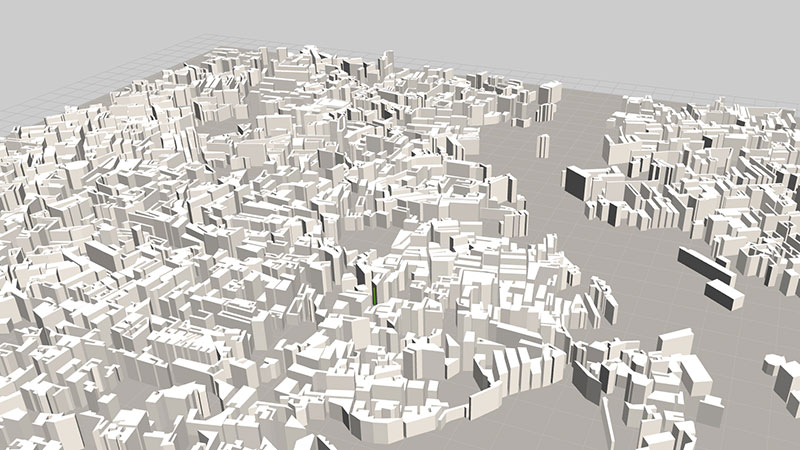
The heights are off (random values) but you can clearly see that this is some sort of urban area. If you know London well enough then you can already start to recognise some of the buildings!
What amazed me most at this stage was that everything ran at a silky-smooth 60fps, on all the devices I tested on. In my naivety, I assumed that visualising such a huge quantity of objects (many thousands) would be too much for WebGL. It turns out it isn't, and after seeing examples of Three.js rendering over a hundred thousand objects I can see that I was wrong to assume any less.
Experimenting with SSAO and tilt-shift
After the success with buildings I decided to take a stab at two visual effects that would help really make ViziCities pop; Screen Space Ambient Occlusion (SSAO), and tilt-shift.
SSAO is a rendering technique that analyses the depth buffer to work out which objects are occluding (overlapping) others and applies a faux-shading effect around the edges of objects to give them definition. This sort of effect is sometimes referred to as clay rendering.
When done wrong, the results look pretty appalling…
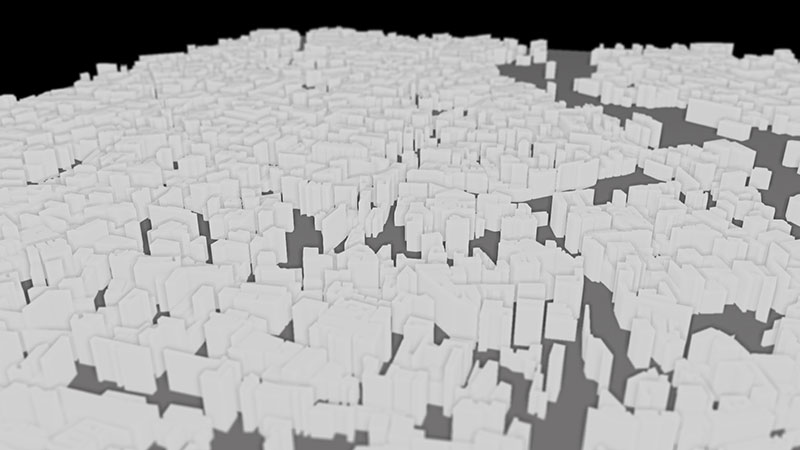
But when refined and combined with better lighting, the result can make an entire 3D scene pop out and bite you in the face. It's a beautiful effect that adds a whole element of realism to the scene.
In the example above you can also see the tilt-shift effect that we applied alongside SSAO to give the feeling of miniaturisation. It's a similar effect to the one SimCity used in its latest game and it's commonly used in photography to make urban spaces look small and toy-like. There's something about the tilt-shift effect that we absolutely love.
Adding natural features
Although buildings are the lifeblood of any legitimate city, there are many natural features that are needed to complete it.
It was at this point that I took the Ordnance Survey and OpenStreetMap data and merged together a selection of common natural features for London; particularly the river Thames, bodies of water, fields, and large areas of trees.
The results speak for themselve…
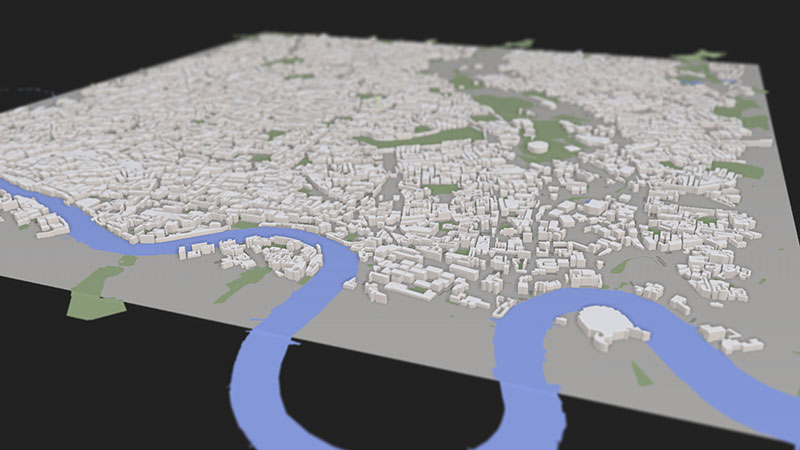
It's actually a very minor visual addition to the scene but the river alone creates a feeling of context that allows you to get a much better idea about where in London this actually is. For those who are interested, it's the area North of the Thames between the Houses of Parliament and the O2 Arena (aka. Millennium Dome), the latter of which you can see in the bottom right-hand corner (in a rather unflattering level of detail).
Make no mistake. At this point we knew that this was no longer just a 3D model, this was beginning to become London.
Adding roads
Another feature that people recognise about cities is roads; after all, that's what most people use traditional maps for. They're an urban feature that we knew from the very beginning that we had to include — you just can't have a city without roads.
To begin with I took a series of road 'nodes' (points) from Ordnance Survey that described every junction in London. From here I outputted them in a basic scene similar to the initial building scene.
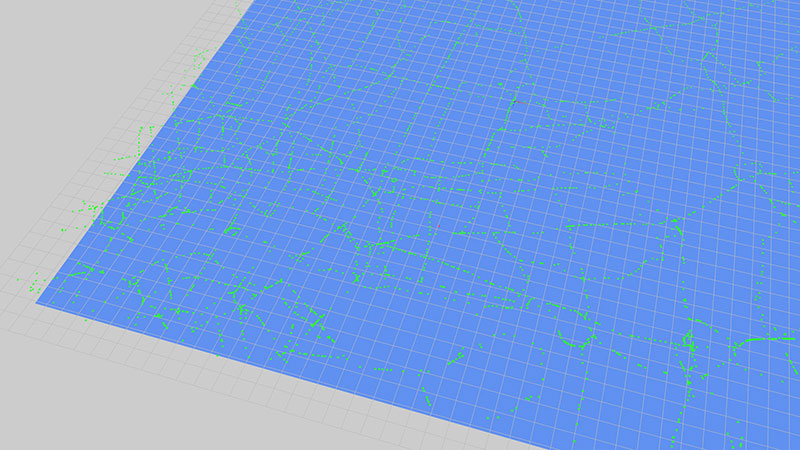
Although unconnected, you can already see the roads beginning to appear, as well as geographic features like the river.
Using lines as roads
By connecting the nodes we started to get a better idea about what the roads could look like, although it was far from perfect.
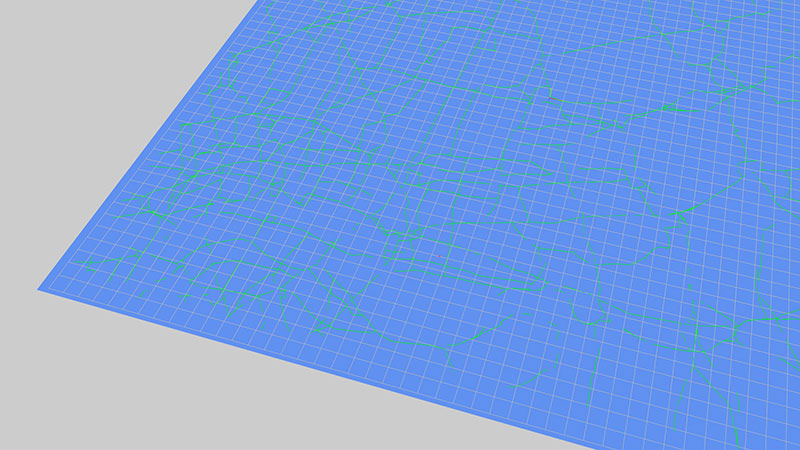
You'll notice that there are a whole bunch of gaps between the roads. In hindsight, I now know why that is (using junctions is not the right way to do this) however there is also another problem in that the line width is kept at all zoom levels. Things look a little unrealistic when you have really thin lines when you zoom all the way in, or really thick lines when you zoom out. We could have used ribbons in Three.js but we instead decided to explore other options for drawing roads.
Using voids to infer roads
One of these alternative options was to output the spaces between roads as polygons (effectively, city blocks) and infer the position of roads by the void left between these polygons. This approach allowed us to create a decent representation of roads…
It wasn't perfect though, as can be seen by the huge expanse of solid green in the top right-hand corner. This is because the approach I'm taking doesn't include every single tiny road in London, just the larger A and B roads. The unfortunate effect of this is that there are sometimes small gaps where a smaller road might be, meaning that the algorithm used to calculate city blocks can overlook legitimate areas that should be a road.
Simplifying the void approach
Instead, the final approach I went for was to expand the building outlines to create a sort of pavement effect. The void left between these expanded building outlines had a similar effect of looking like roads, albeit slightly less detailed than the previous approach.
Though not perfect, this approach was good enough for our needs and when combined with natural features it did create an effect that looked like roads between buildings.
We're not ruling out another look at using ribbons as roads, as this would certainly be the 'perfect' solution. For now though, this will do.
Adding data layers
Visualising cities, at least the visible aspect of them, is only part of what the project is about. A secondary focus of the project is the visualisation of data that, when combined with the buildings and natural features, creates a whole new level of context and exploration.
Bar charts
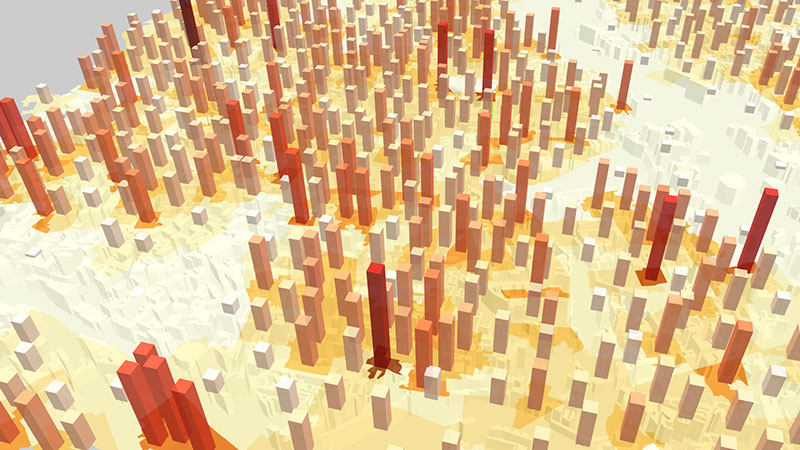
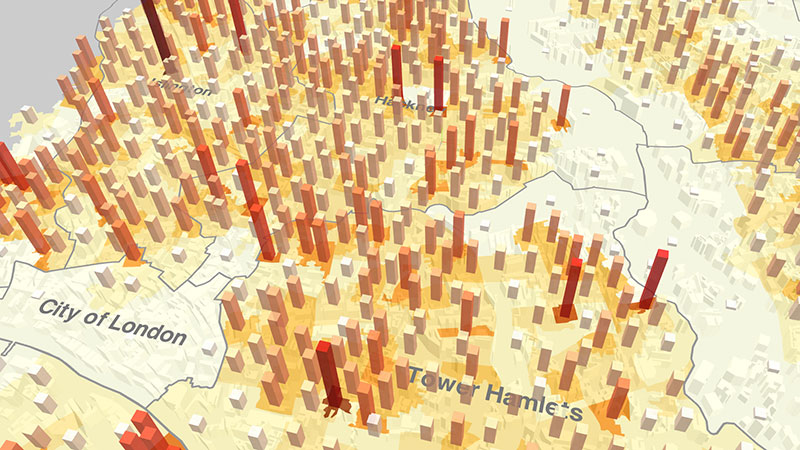
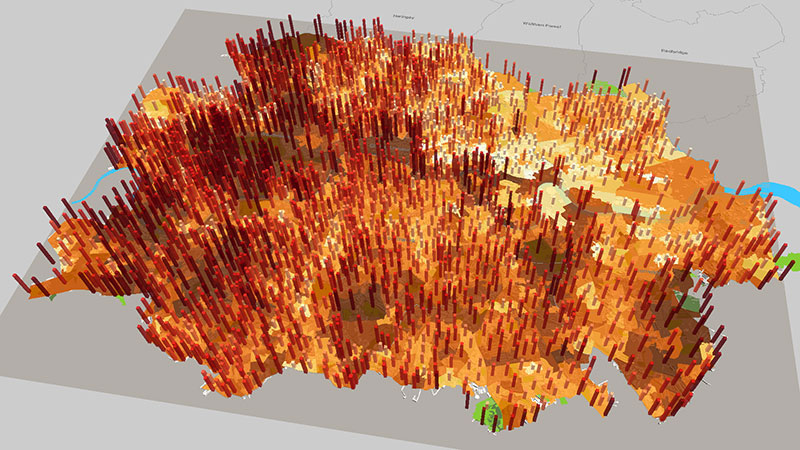
We could have started anywhere with data, so the decision was made to grab the first usable data source that we could find (population density) and create a naive bar-chart effect to see what it looked like.
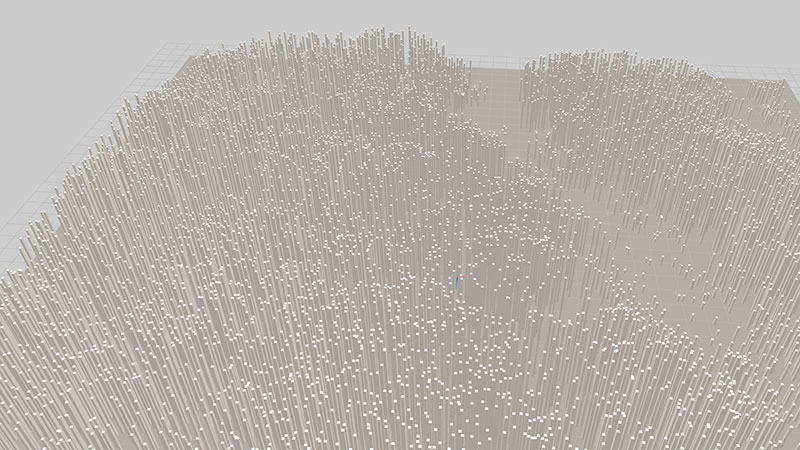
As you can see, it's a bit crazy. It's sort of like those toys you can get which are full of pins that people can't stop pressing their faces into.
To simplify things I only outputted bars at what are known as Lower Layer Super Output Areas (LSOAs — no idea where the second L went). LSOAs are commonly used in the UK for census data and other data that needs to describe detailed geographic areas smaller than boroughs and neighbourhoods, though not as detailed as per-street.
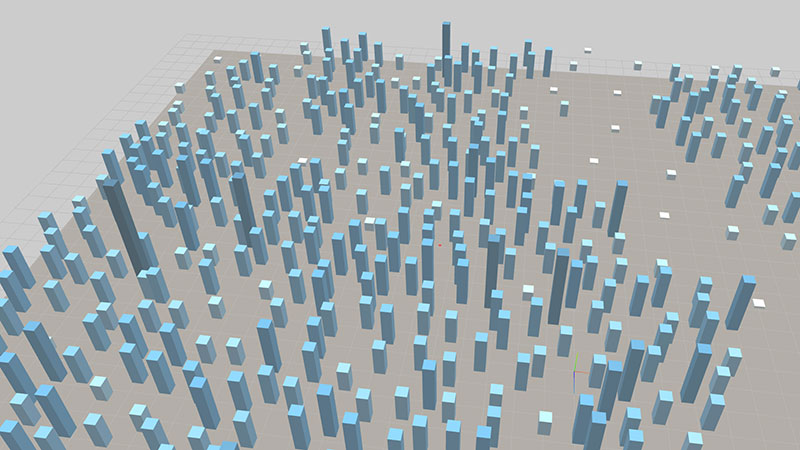
As you can see, I also added a rough colour scale to get an idea of low and high values.
Without the city underneath it's kind of hard to get any context, so that's what was added next.
It was at this point that things were beginning to look and feel like the data layers from SimCity that inspired us so much.
Something was missing though.
Heatmaps
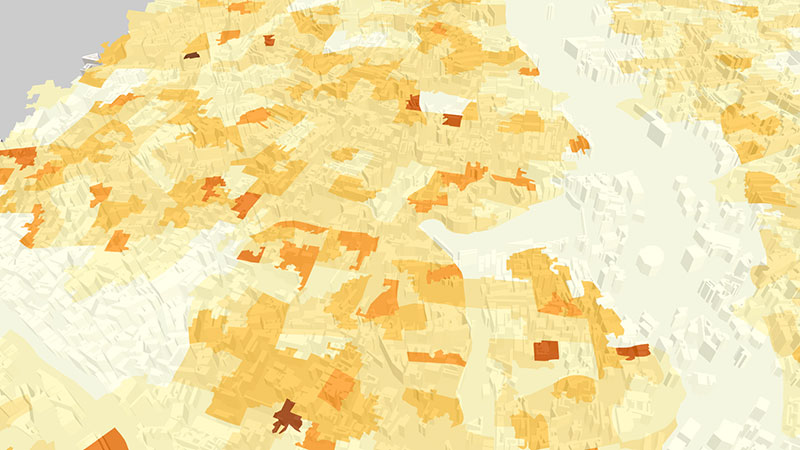
The first iteration of heatmaps used the LSOA outlines and coloured each one based on it's population density value. As you can see, the area in the top-right corner is very light as no one likes living in parks or marshland.
Couple with bars, the resulting data layer was a sight to behold!
We could do better though, with the data laid over the top of the city (you can just about see the buildings through it) it was hard to grasp the geographic context.
To solve this I added borough outlines.
The result, as I'm sure you'll agree, is much better than before. It's now practically impossible to mis-read the data from a geographic context, plus it actually allows you to start comparing different, known locations around London. Things were getting interesting.
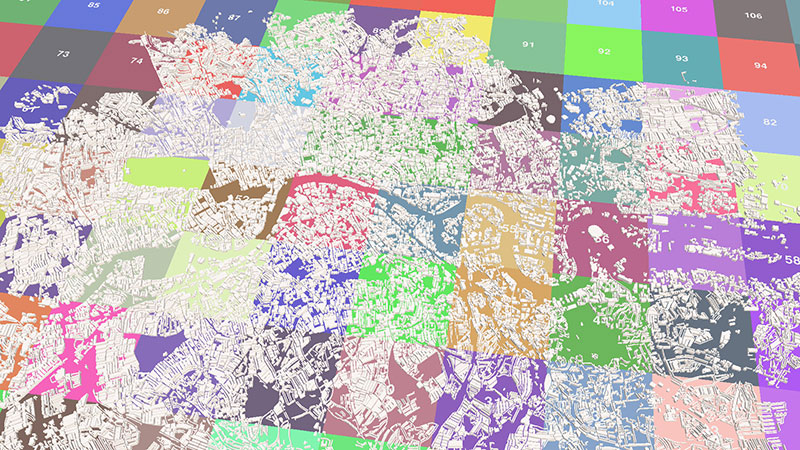
Most recently, we experimented with slightly more obvious borough outlines and a hexagon grid for the heatmap rather that LSOA outlines.
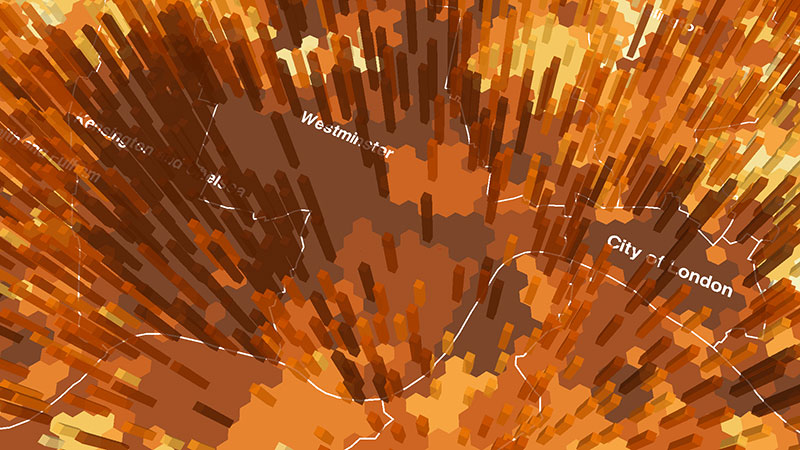
I'm a big fan of the hexagon grid; I think it looks neat (in all senses of the word). It reminds me a little of games like Risk.
Experimenting with AI
Unsatisfied with tackling buildings, natural features, roads, and data; the next challenge was to implement AI. Specifically, cars driving along the roads with no prior instruction.
There are a million and one ways to tackle this problem depending on the level of detail you want. We wanted something simple so we kept things basic. The approach that we went for was to create a lookup table that represented every single road segment in the city. From there, we could create AI that simply moved from segment to segment, turning at segments that were connected to more than one segment (junctions).
The result was simply jaw-dropping, if I do say so myself.
As always, it isn't perfect (the AI don't move at a set speed) but it's a fantastic starting point that we're looking forward to expanding out in the near future.
When coupled with the 3D buildings and natural features, the AI really does make the city look like it's alive.
I can't wait to refine what we have and add the other AI ideas that we've got planned!
Expanding London
At this point we decided that we'd learnt enough about this small area of London and wanted to expand.
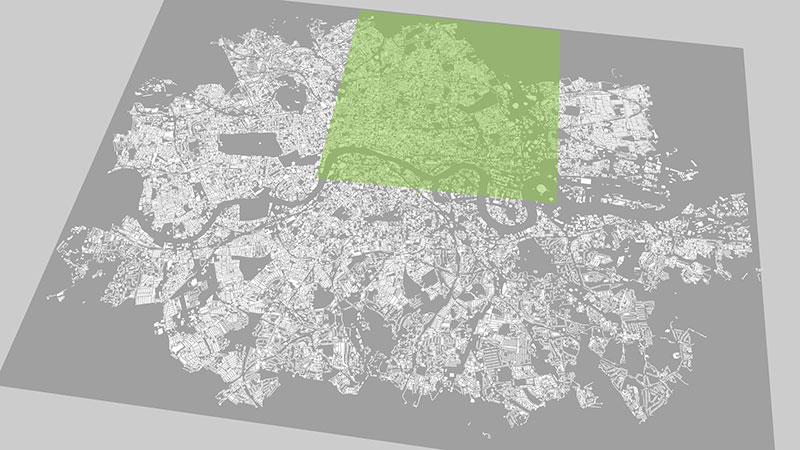
Compared to the original section of London (in green) the new, larger section was a massive upgrade. When everything was added, data and all, the effect was quite beautiful.
It really looked like London, the shape and everything.
Improving performance
Unfortunately, in our efforts for global domination we quickly discovered the performance limitations of the project as it stood, as well as my personal knowledge with Three.js and WebGL. In short, the expanded version of London ran at a horrible 20–40fps depending on the system you viewed it on.
To solve this, I spent a good week purely focussed on learning and implementing methods to increase performance en-masse. The aim was to get things back up to 60fps, at least when zoomed in.
Frustum culling
The first problem was that the method I had used to visualise buildings (merging them into a single object) meant that a technique called frustum culling would no longer work. This technique doesn't render objects that are outside of the view frustum (screen edges) and so lightens the load on the GPU by only rendering what's visible. In my case, by using a single, giant object it was always going to try and render the entire thing because it was always in view.
Fortunately, solving the frustum issue was simple. All that was needed was to split the city into a grid of smaller areas that could fall outside of the view frustum.
While this patchwork-like approach didn't improve things when zoomed out, it dramatically improved performance when zoomed in. In fact, this fix alone bumped things to 60fps when zoomed in, simply because unnecessary objects weren't being rendered.
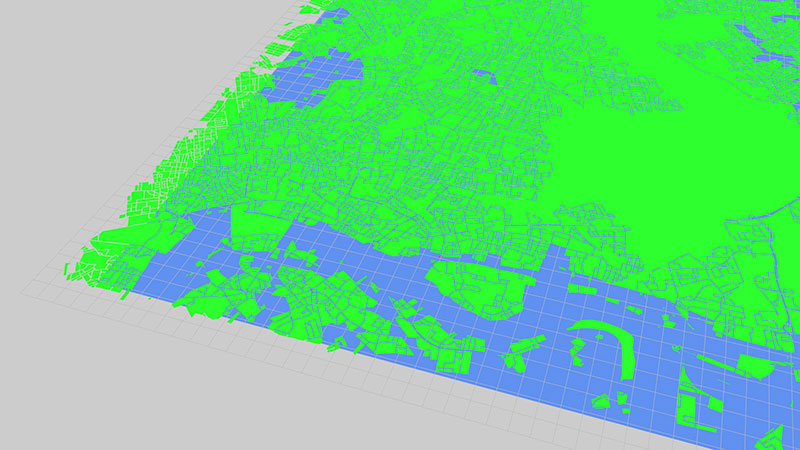
Level of detail
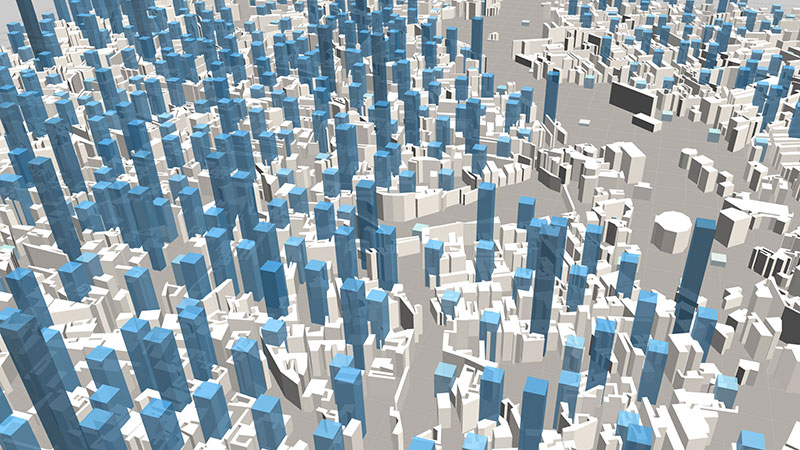
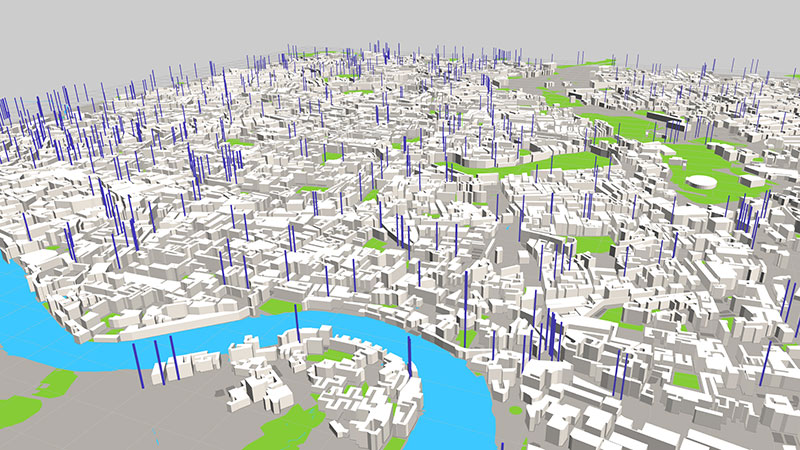
To take things a step further I decided to tackle the performance problem when zoomed out. There are a couple of approaches to take here; like removing smaller objects or reducing the level of detail (LOD) as you zoom out. I took the second approach and utilised the LOD functionality built into Three.js.
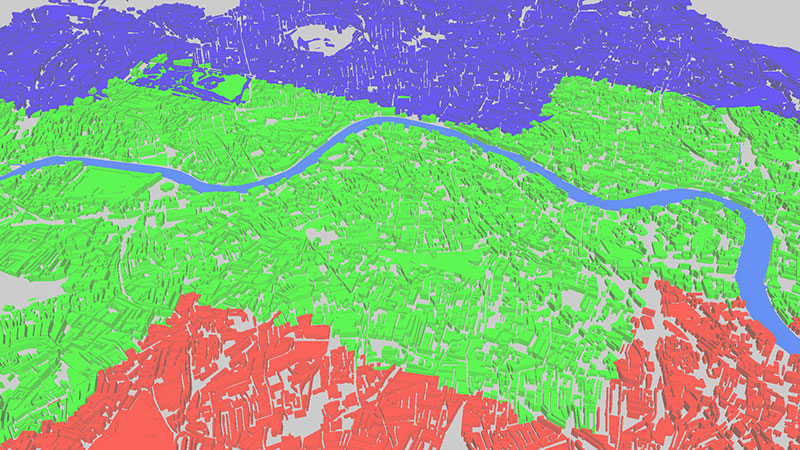
What you can see is the new LOD approach in action. High-detail objects are in red, medium-detail in green, and low-detail in blue.
This technique didn't quite bump things up to 60fps but it was certainly a whole lot better!
Taking a new approach
Based on what we learnt from the prior work, specifically the performance issues, we decided to take a different approach to the visual design of the project.
What we already knew from the initial work with a small section of London (8x8km isn't very small, really) was that it performed very well on most devices we tested on. This was partly due to the smaller number of objects, though it's arguably more because there is a defined limitation on size that we're working within. This means that we can optimise performance in a controlled fashion as we always know how big the area we're rendering is. Compare this to the naive approach we originally took in which we aimed to render an entire city all in one go.
It's not all roses though. The problem with rendering a smaller area of a city is that you only see a small part of it. We're still committed to bringing entire cities to life with ViziCities so we're looking at a new approach that couples the controlled nature of a small geographic area with the ability to explore a large city.
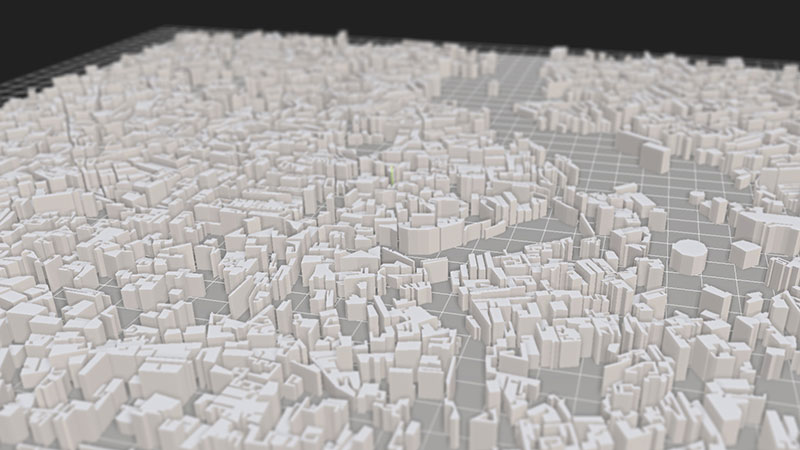
Part of our solution is to set the 8x8km section of the city what we're calling a plinth, which really enforces the miniaturisation effect when combined with SSAO and tilt-shift.
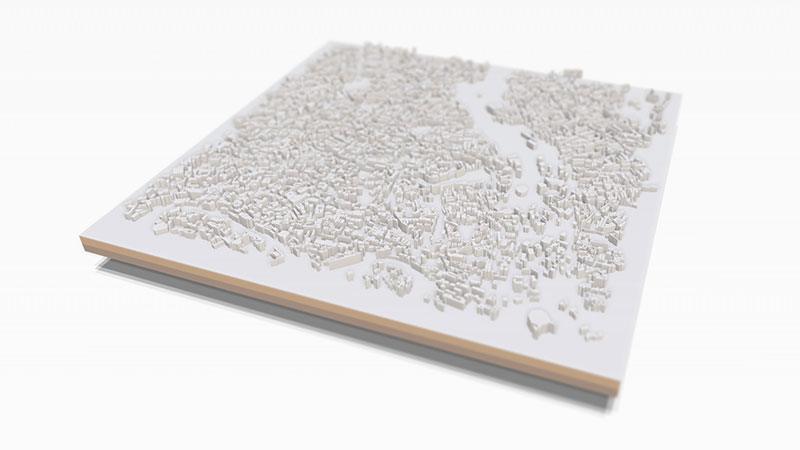
There are many more parts to this approach that we're yet to implement; namely the parts that enforce that you're seeing just one small part of a much larger city, as well as the parts that allow you to navigate around that larger city.
We're still working on those bits but we're very happy with how the plinth concept is looking so far.
The next month
We've certainly come a heck of a long way since we started from scratch just over 30 days ago. If I'm to be honest, after compiling and writing this entry I'm actually in a state of disbelief about how much we've managed to get done in such a short space of time.
Rest assured, we haven't stopped and we're far from completing our vision.
Here's an unfairly-blurred look at something we're very excited about that we've not really mentioned before now.
Be the first to get beta access
I hope this insight has given you a better idea about what ViziCities is and what we've been up to this past month.
Make sure that you sign up for the beta to be amongst the first to use it. You should also follow ViziCities on Twitter, as well as Pete and myself.
We're massively excited about what we're working on. Watch this space!